What next for stocks

2023 has seen
strong performances for many stock markets around the world, and even with the small correction in the last couple of weeks, the S&P500 is still up over 16% so far this year and the Nasdaq a whopping 36%. And it’s not just in the US, with the main indices in Germany and France up almost 13% and Japan up 26%,
all above average returns for this stage of the year.
Surprisingly this strength caught many traders on the wrong side, with the majority (based on positioning we can see through the commitments of traders’ report) expecting a continuation of the weakness we saw in stock markets around the world in 2022.
This strong performance, however, is exactly what we would expect to see in 2023. With 2023 is a Pre-election year, and the last 10 Pre-election years have seen gains of 14.8% on average for the S&P500 from January to July, and none of those years being negative during the period, as we can see from the 100% success rate on the chart below. 10 years, 10 positive returns.
The real question now is, what does the rest of the year have in store for stocks?
The answer unfortunately,
is not more of the same. Pre-election
years are well known
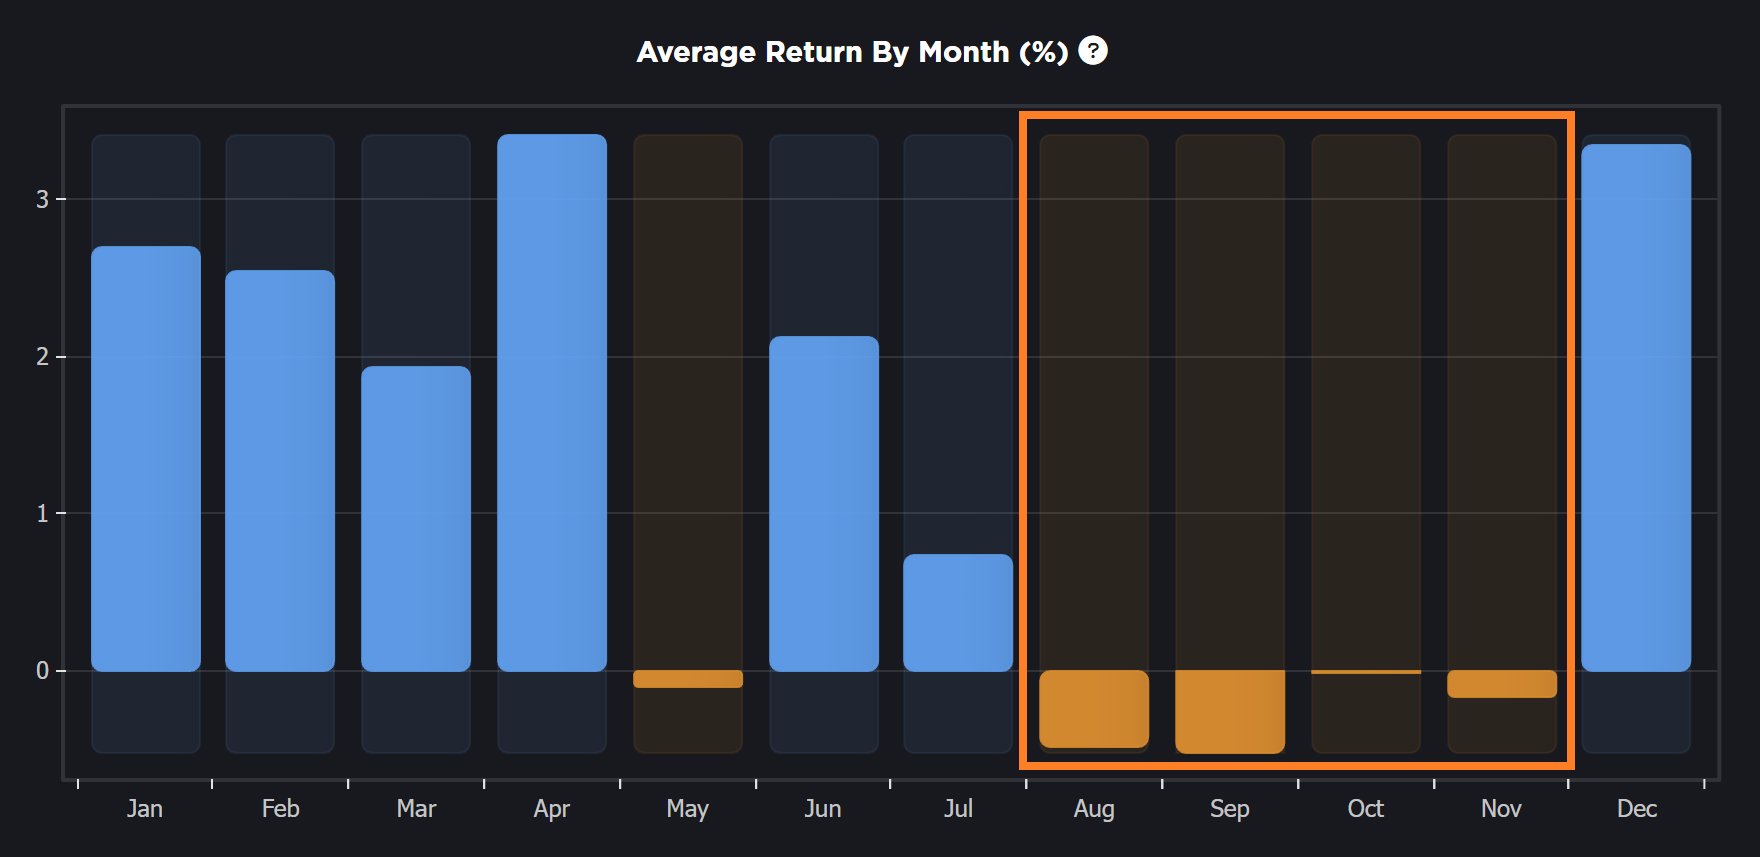
(although clearly not as well-known as they should be) for their first 6-month strong performances but also notorious for an under-performance in the 2nd half of those years,
particularly through the months of August, September, October, and November, as we can see on the
average monthly return chart on the right.
So, do we just start selling now?
It’s not that simple either.
The next chart below tells an even more underwhelming story. The S&P500 has returned an average of 0% from July to December in Pre-election years, with a 50/50 chance of being positive/negative during that time. To underline the point further that conditions could be tricky, our AI is basically telling us to stay away for the next few months. Notice the red bars along the bottom of this chart. These bars highlight the optimum periods our AI has identified to trade this market, and you will notice there are no bars from August to November.
This means it has not been able to find any
consistency in either this market’s direction or its returns during this period, implying much harder conditions to trade. In contrast, the 4 periods it identified from January to July
saw it gain almost 11% of the market’s total 16% YTD returns. Impressive returns over very short periods of time.
What is the path ahead.
Probabilities may be reduced, and conditions could be tricky over the next few months, but it doesn’t mean there will be no opportunities. The chart below
shows the two most likely paths the S&P500 could take from here and interestingly they both suggest we could see a decent end to the year, so
I will be approaching stocks from this perspective and preparing for a major September or October low.
The purple line is the Pre-election year, which suggests current weakness should come to an end soon, leading to a weak bounce before selling returns in October,
then making a low and running higher into year end. The blue line is
a custom pattern based on current price action and it suggests more downside is possible now before bottoming out in September and
then seeing a strong rally.
Both patterns give a
greater than 70% chance of a positive end to the year for stocks at this point, but I will let the market confirm to me over the coming weeks which path it is following, and then
use our custom pattern finder to hone in on the path ahead, to see if the chances of a year end rally increase even further.
The trading strategy I will use from here is to continue to
trade smaller time frame momentum moves over the coming weeks in both stock indices and individual stocks, while building a larger list of stocks who's
optimum patterns also suggest a strong end to the year,
where I can trade on a more
medium-term basis or look to buy and hold them into 2024.
If you'd like to do this for yourself,
log in to our seasonal dashboard here and use our
patterns panel to identify optimum patterns for the S&P500 as well as hundreds of other markets.
Happy trading
Ray Gilmour
Founder & Senior analyst at Markets Made Clear.com