Market Seasonality
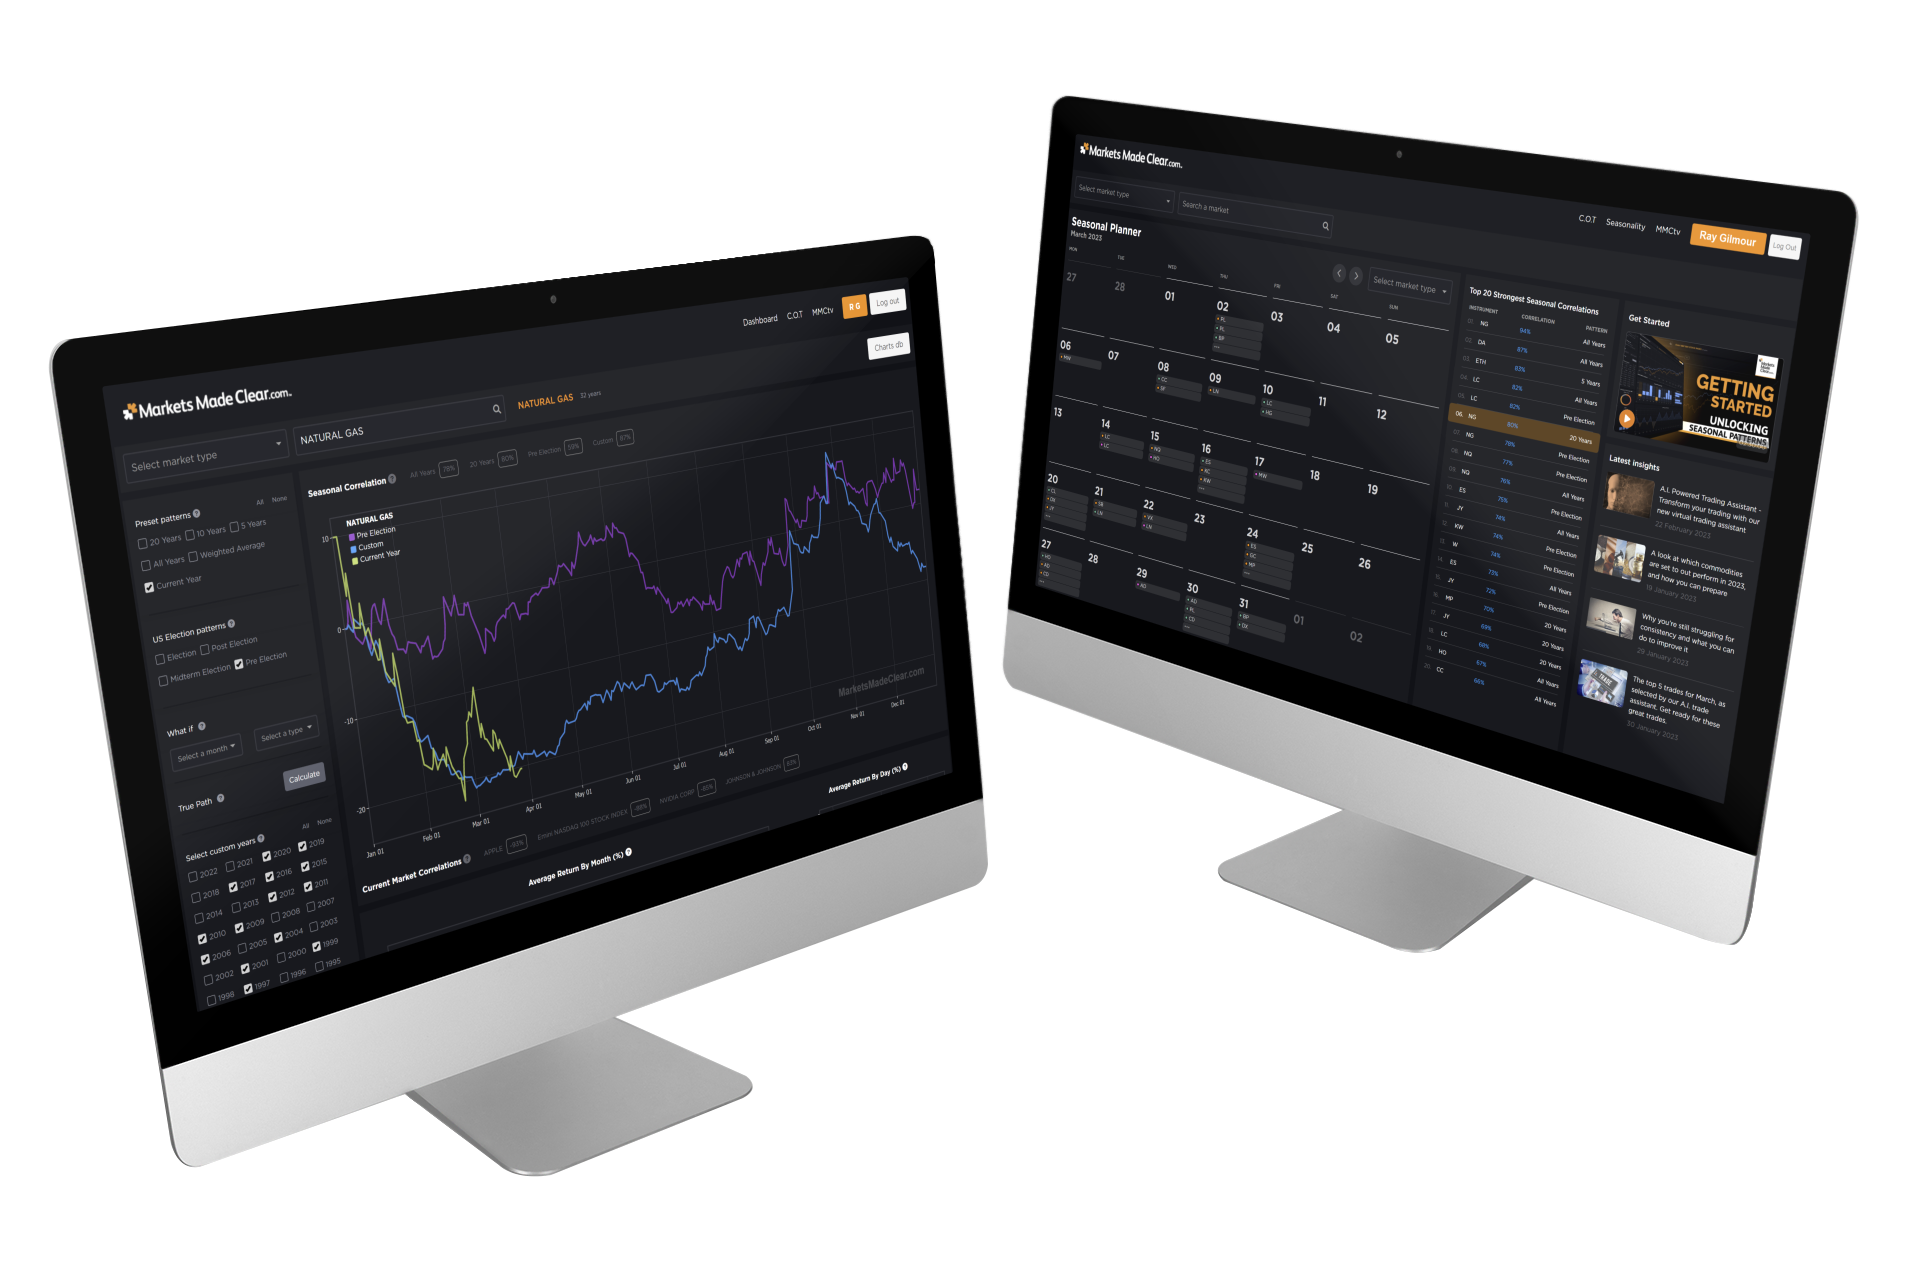
The most advanced seasonal software available anywhere online. Check out our
free seasonal recourses below or
log in to our seasonal platform to get A.I. generated trade ideas or to find your own custom patterns.
What is Seasonality?
Seasonality is the
study of a market over time to establish if there is a
regular and predictable change that occurs within that markets price
every calendar year. Every market experiences
periods of either greater supply or demand throughout the year, and it is these forces that drive seasonal patterns. Seasonal studies allow us to establish when these periods are, to give us an indication ahead of time how a market could perform in the future.
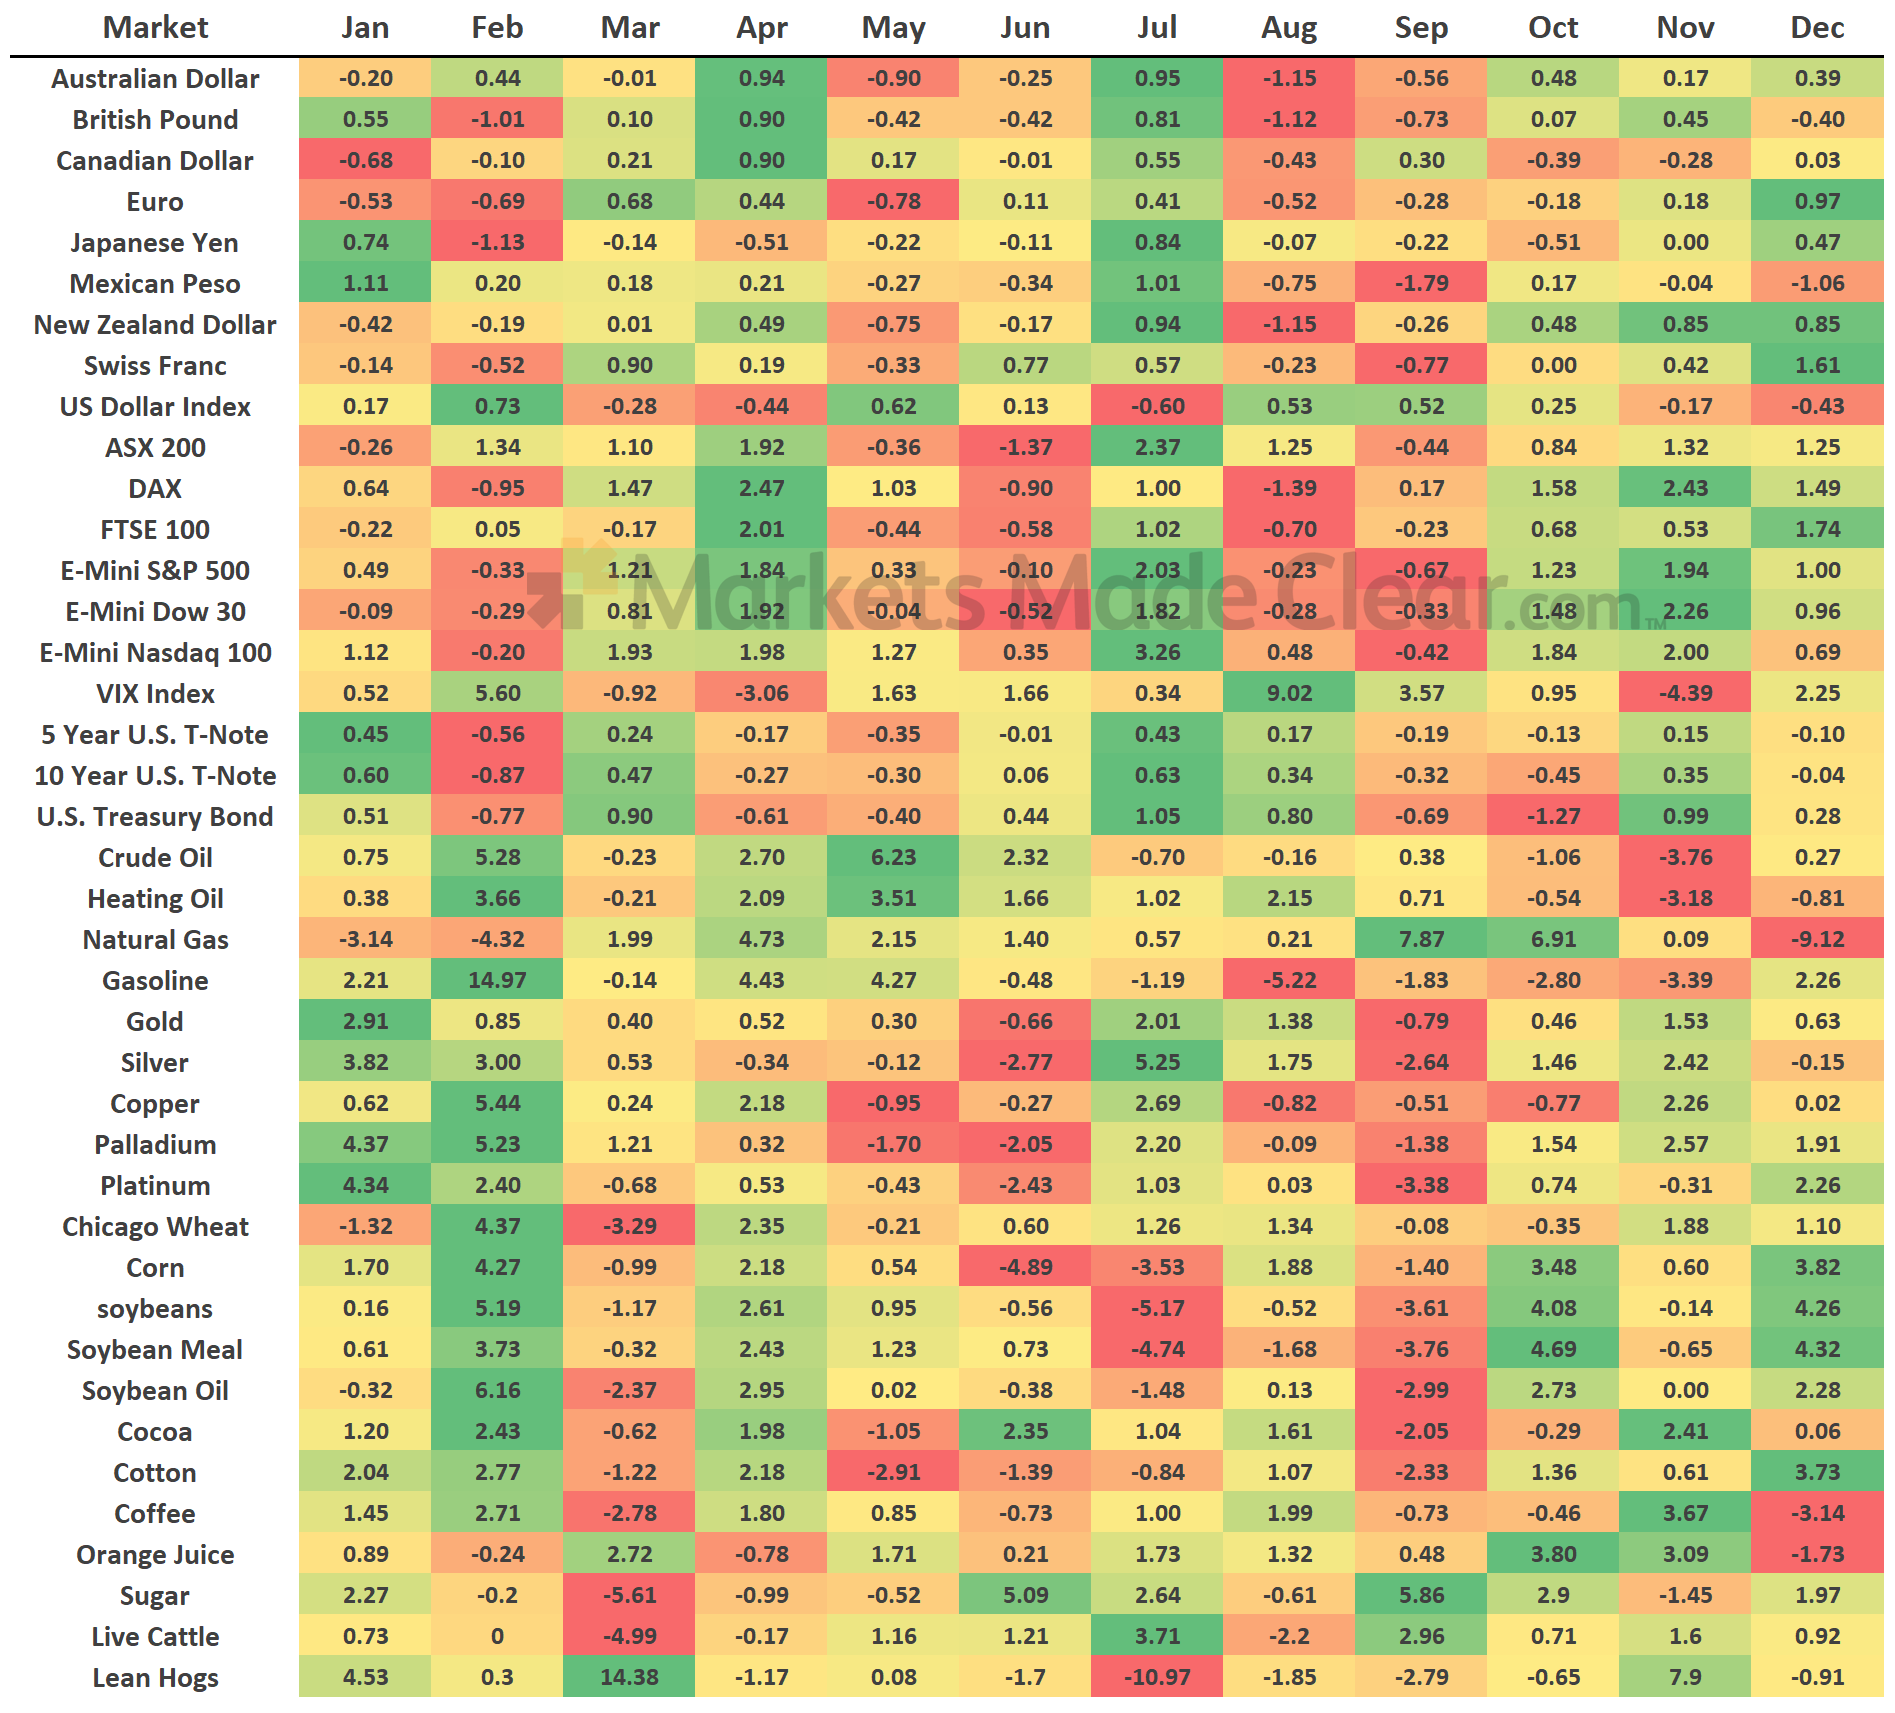
Below is our popular monthly performance heat map which shows the average % change in each market
every month over the last 20 years. This is an excellent resourse to help quickly identify which markets are
set to start bullish or bearish seasonal patterns at any time through the year.
Monthly Performance Heat Map
This heat map shows the average historical % change in price each month. Use the heat map
as a starting point to help find the biggest movers each month.
(Percentages updated for 2024)
From the heat map to the chart
When you've found a market on the heat map that looks interesting, you can then dig a little deeper and take a look at that markets
full seasonal chart so you can
identify the start and end dates of any seasonal move. If we use the British Pound as an example, when you navigate to the main seasonal chart (below), our AI will show you the
optimum times to trade that market. One great example is the bullish pattern in April, with a
buy date from March 25th to April 17th having an 85% success rate over the last 20 years.
British Pound 20-year seasonal pattern
Or in the case of Gold,
the heat map suggests July and August is a positive period for the metal, but again does not tell us when this period begins or ends, so the seasonal chart is vital to help nail down those details.
You can rely on our AI to show you optimum dates or
you can use the custom pattern finder to identify your own optimum seasonal pattern. Such as the buy date from June 30th to August 27th, which has a success rate of 75% over the last 20 years
. Critical information like this will give your trading an edge.
Gold 20-year seasonal pattern.
Let A.I. do the hard work
Our seasonal software
uses A.I. to pinpoint the optimum time to trade any market and will give you all
the performance stats to back it up. Buy patterns, sell patterns, lasting days to months, and in any market. Finding optimum conditions like these are
where you will find the best trades, helping to stack the odds in your favour.
Try our new Seasonal platform
Get access to all this plus much more with our seasonal platform. Hand picked trades ideas every month, generated by A.I. so you can focus on trading the highest quality markets.
Below is a selection of major markets you will have access to within our seasonal software. In addition to these there is also a wide range of
seasonally significant US stocks and UK stocks, with the
database growing all the time.
For a full list of markets covered,
click here.
| Currencies |
Stock Indices |
Energies |
Softs |
| Euro |
S&P 500 |
Crude Oil |
Coffee |
| British Pound |
Dow 30 |
Heating Oil |
Cocoa |
| US Dollar Index |
Nasdaq 100 |
Natural Gas |
Sugar |
| Australian Dollar |
FTSE 100 |
Gasoline |
Cotton |
| New Zealand Dollar |
DAX |
|
Lumber |
| Canadian Dollar |
CAC 40 |
Metals |
Orange Juice |
| Japanese Yen |
Nikkei 225 |
Gold |
|
| Mexican Peso |
|
Silver |
Grains |
| Swiss Franc |
US Sectors |
Platinum |
Wheat |
| |
Con' Staples |
Palladium |
Corn |
| Presidential cycles |
Con' Discretionary |
Copper |
Soybeans |
| US Dollar Index |
Financials |
|
Soybean Meal |
| Euro |
Energy |
Treasurys |
Soybean Oil |
| British Pound |
Industrials |
10-Year |
|
| Australian Dollar |
Materials |
5-Year |
|
| Japanese Yen |
Utilities |
US - Bond |
|
| S&P 500 |
Technology |
|
|
| Gold |
Healthcare |
|
|
| Crude Oil |
|
|
|