Trade Ideas
Direct from the MMC™ trading team and exclusively for TradeSeeker™ Members, our trade ideas are aimed at providing you with the research and analysis needed to help you get the most from TradeSeeker™
and its unique and powerful data.
(Please note that these are only a small number of the possible trades that could be taken using our data
and the information provided here should be used to find similar opportunities in other markets.
For other news and updates, you may wish to follow us on your favorite social media platforms)
 NEW TRADE - Crude Oil
The energy sector is back on our radar again as we approach the seasonally bearish period for a number of markets in the sector through October and November. We have highlighted Crude oil here but Heating oil is also on our watch list and will be looking for short signals in both.
CoT data for both markets are currently still bullish but the next couple of releases in the data will hopefully confirm our bearish view for the coming months. A continued increase in Commercial selling, coupled with a decrease in buying, should see positions reach levels large enough to force price lower.
There is a significant level of resistance just over head in Crude at $54.50. This will be the area we will be focusing on when looking for a short entry. We will be using both Crude futures (pictured below) and
USO ETF for positions.
.png.aspx?width=65&height=65) NEW TRADE - Euro
NEW TRADE - Euro
The Euro has had a stellar few months driven by speculators realising they are too bearish on the currency which has seen a re-balancing of positions more in line with where Euro is headed. The rush to close shorts has pushed price from 1.06 to the US Dollar, to the current 1.13 and I expect this to continue, but not for long. Speculative longs began to increase through the early part of the current up trend but this has rapidly decreased in recent weeks.
At the same time Commercial positions have seen an accumulation of shorts which has taken them to an all time high, while buying has remained flat. It is our view that these two factors will see the current rally run out of steam and the Commercial shorts weigh on the currency through mid June.
We will remain on the long side for now but in reduced positions and look to short around the technical level of 1.1460. This is in line with the seasonal pattern of the Euro which sees weakness through the summer months.
 NEW TRADE - Copper
Copper was without doubt one of the big stories of 2016, with it's rally catching even many experienced traders out. It shouldn't have been a surprise however as we had been alerted to it potential as early as June last year (3 months before the rally) when commercial buying had already reached an all time high. This was followed a few weeks later by speculators covering their large short position by buying dips in the market. It was clear from the data that sentiment had turned bullish on the metal.
This time around we are looking to sell, but not yet. With commercials still hedging by buying the current rally we believe there is still room to the upside for now. A push towards the $3 level over the next couple of weeks could provide the perfect short entry. This level has been respected many times in recent years and is also the 38.2 fib retracement from the highs in 2011, and would also coincide with the seasonal bullish period ending in March. Pay close attention to the CoT data over the coming weeks for an increase in commercial selling but a drop off in buying if we push into $3.
N.B. we are bullish longer term on copper so will therefore be waiting very patiently for a buy signal later in the year.
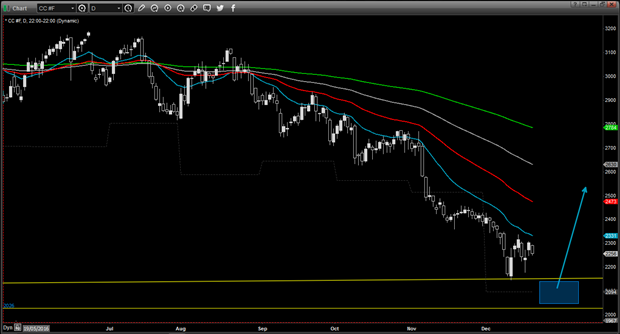
 NEW TRADE - Cocoa
Cocoa is always on our watch around this time of year as due to its seasonal tendency to rally at the beginning of a new year. The last few weeks of the year can bring sharp falls however so we are mindful that patience is key, and we must wait for the perfect set up.
So with the tendency in place, our attention is now firmly on our CoT data to give us the confirmation a seasonal rally is possible. Looking at the data, commercials have indeed, as we would like to see, been heavy buyers in recent weeks as Cocoa reaches prices not seen since 2013. Commercial longs have continued to push to all time highs in the last 3 weeks, taking commercials net long in the process, a move not seen since the end of 2011 in market conditions very similar to what we are seeing today. It is important to note that the same conditions then seen the beginning or a 2 year bull market.
We have identified a zone to be potential buyers, between 2130 and 2050. These prices represent a level from a 4 year trend line and a major horizontal level below. There is also a monthly S2 level in between both levels at 2086.
We recommending waiting for a rejection of this zone, preferably early in the new year before entering. A drop in commercial shorts over the next couple of weeks would also be a very bullish condition should an entry present itself.
2016 Trade Ideas performance summary
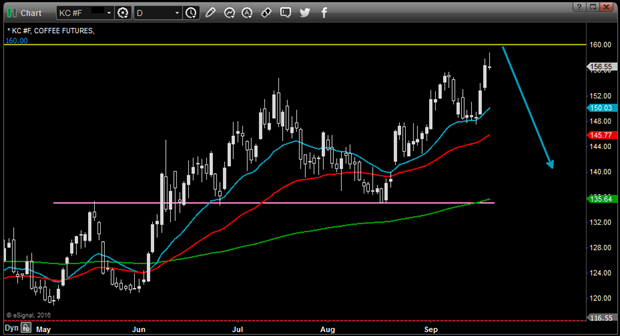
 NEW TRADE - Coffee
This is a market we have been patpatiently waiting to come to us for a while now. The 160 level has been a major area of interest where we have been wanting to get short of this market. We did think price was not going to reach 160 and perhaps miss out on this trade but the market appears to be making one last push for this price. A great example of why patience is so important when trading with CoT data.
Commercials had started to build a large short earlier in the summer but the pace of that has eased and as a result we are not expecting a big decline but certainly a push towards 148 or even 135 is possible. We will then watch the reaction in non-commercial Longs to see if they bail out after a turn.
We are in the bearish seasonal period for coffee so we will look to stay short until mid October when this market becomes less bearish. A lack of momentum to the downside in this period will see us taking profit early.
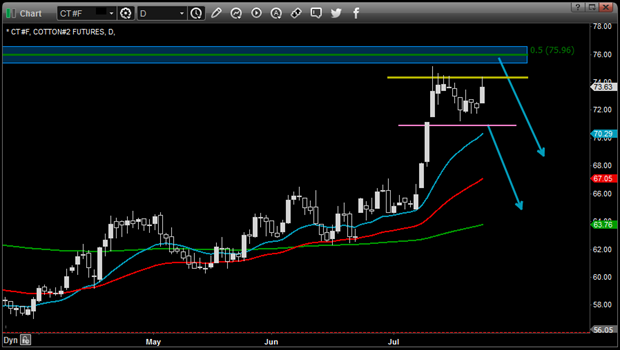
 NEW TRADE - Cotton
You may remember we called for a low in this market back in March of this year and since then this market has staged a remarkable rally. At that time Commercial traders had amassed their largest long position in over two and a half years, pushing the long term 36 Month CoT Index to a 100% extreme. Some of you may still be in the original long trade we posted
(the optimum way to use CoT Index extremes is to stay long or short between extremes, meaning you would still be long from the extreme in March until the opposite extreme short signal is posted). As it stands we are now nearing the opposite short signal and are on the look out for a possible short entries.
Commercial trader have now built the largest short position since September 2010, pushing the long term CoT Index to almost 0% (we expect it to reach 0% on the release of this coming week's new data so keep watch) as we near the end of Cotton's seasonally bullish period.
There is many resistance levels ahead that could trigger a reversal, a major resistance zone exists between 75.50 to 76.50, the 50% Fib retracement from 2014 highs also conincides with the 76.00 level, with the monthly R3 Pivot level sitting a little lover at 74.30. Price is currently making a second push towards these levels following the initial surge at the start of the month, we are waiting on a clear second rejection of the zone highlighted with a bearish price action signal before entering a trade. If a push higher fails, a break through the pink level would also provide a valid entry on confirmation of a new down trend formation.
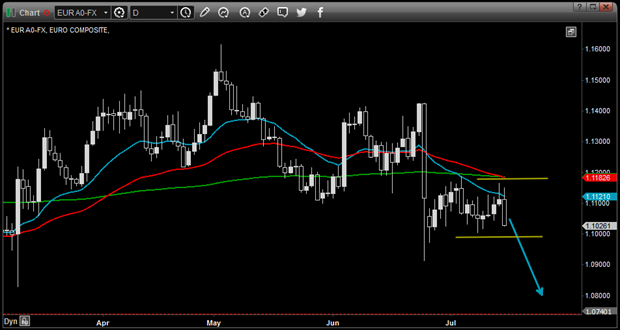
 NEW TRADE - Euro
Since Since the 'Brexit' result we have been paying close attention to non-commercial positions in all our major FX currencies and in particular this market to give us an indication as to where these markets are headed. Over the last few weeks as the Euro's price has ranged between 1.1200 and 1.1000 but speculators have slowly added to their short position, continuing their rise since the decline starting May this year..
Seasonally Euro along with many other currencies underperform in the coming weeks and the size of the current Euro short position is indicating this is likely to be the case this year as well. A break of current levels will confirm these views before entering.
 NEW TRADE - Sugar
Sugar is another agri commodity that has become 'over valued' in recent weeks following the commodity rally we have seen in many agri markets. From the current strong level of resistance @20 Cents, we are now looking to take short positions as a correction develops.
The main driver behind a possible correction is the fact Commercials have been aggressively selling in recent weeks which has seen their short position grow to the largest held in over 8 years. It is this growing short position that has seen each of the Commercial CoT index values (36m, 18m & 6m) reach the bearish 0%.
We have highlighted a number of options below to look for an entry point. 'A' is a break of the previous swing low, breaking the previous up trend, 'B' is a later but safer entry, using a 13 day trend following system we like to implement here @MMC. The current position of 'B' is the lowest bar low of the last 13 days, this will of course change as new bars form so please update each day as we near entry. In both cases the stop will be positioned at the red line above resistance.
 NEW TRADE - Soybeans
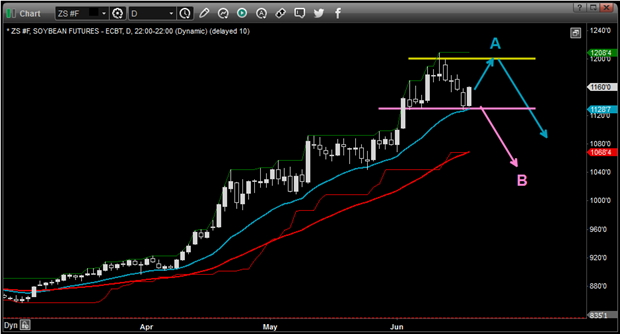
We posted our first Soybean trade alert back in 31st Jan of this year, just two weeks before it bottomed and began the near 5 month rally we have witnessed since. Then we called for a long entry in line with the extreme accumulation of long contracts by commercials and the seasonal rally we typically see through March and April. Now the same information is indicating a potential decline, with commercial traders this time building their largest ever short position consisting of 582,142 short contracts, some 20,000 more than we seen back in July 2012, resulting at that time in a swift decline which has since marked the all time high for the Soybean market.
Timing an entry as always will be important in oder to capitalise in a potential decline in price and we have identified two possible entry points below. From the current position we could see non-commercials try one last time to push to a new high, a double top at point 'A' would be attractive if price-action presents itself back at that level. Alternatively a break below current support at 'B' would confirm a change in sentiment and of course a break of trend.
 NEW TRADE - Corn
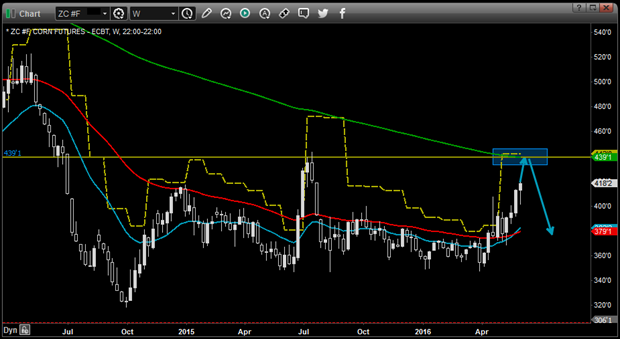
Corn is a market nearing the end of its seasonally bullish period, which typically sees this market decline around mid June and then through July and August. With this in mind we have been keeping a close eye on Commercial selling to see if this year is likely to produce a similar pattern. As it stands we believe it will with the current level of Commercial short contracts in Corn approaching a 5 year high.
Looking at the chart the $4.40 area has held as a major support and resistance level over many years and this area could again prove too strong for this market. This time around the $4.40 level also coincides with the 200 day EMA and also the monthly R2 pivot (a resistance level we like to use here at @ MMC)
Keep on your watch list over the coming weeks and look out for price action if we approach this level and of course also watch Commercial selling to ensure it continues to increase nearing this level. Heavy commercial selling will be the final confirmation before entering any short trade.
 NEW TRADE - Cotton
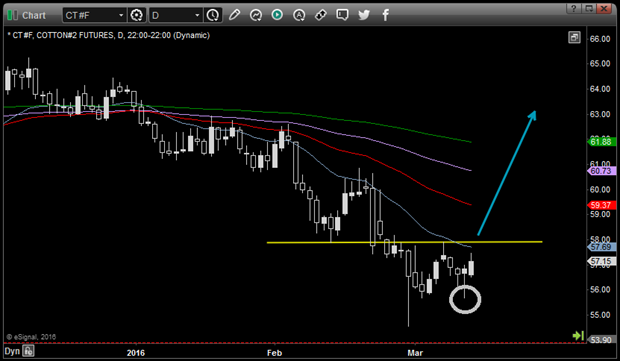
We have have been watching this market over the last few weeks as Cotton entered it's bullish seasonal period. Seasonally we expect a rally from beginning of March through Mid April, and we have been paying close attention to the dominant down trend that has been in place 4th quarter 2015. The latest CoT data shows the continued increase in commercial buying, pushing the Comm index to extreme levels. This buying at a time when we are expecting it gives us confidence that the seasonal pattern will play out.
The recent higher low (circled) has provided the first indication of a break in trend and we are now looking for entries above the previous swing high (marked by yellow line)
 NEW TRADE - Crude Oil
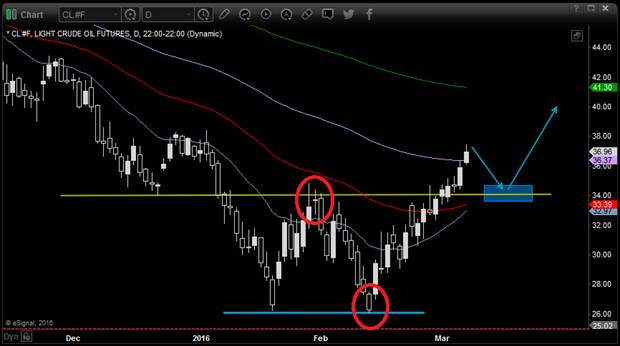
Crude has been one of our favourite markets in recent months, offering excellent short and long entries as we prepared for the seasonal low off the $26 level. Having now broke previous resistance at $34 we are looking for long entries above this level. This level should now provide the market with support and a retest of this area would provide an excellent reward to risk entry as we remain bullish on this market through its expected seasonal peak in mid May.
With commercial traders recording an extreme long position based on COT index readings, we will be staying on the long side of the market until COT index readings turn bearish.
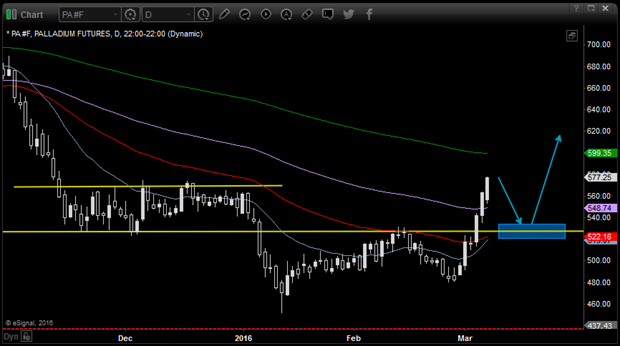
 NEW TRADE - Palladium
Palladium has been bullish on TradeSeeker for a number of weeks but with price action largely range bound we have been waiting for a break above the $525 area to confirm bullish momentum in this market. A retest and rejection of the area highlighted would offer a great entry point but this will be dependant on the market presenting us with a retracement. The current move has come at a time when we can see Comm COT extremes but these are largely driven by reduced selling and not a more market driving increase in buying. Reduced supply in a market is bullish and has caused the current rally but without new buyers the rally is likely to be short lived. Be wary about entering this market much beyond current levels.
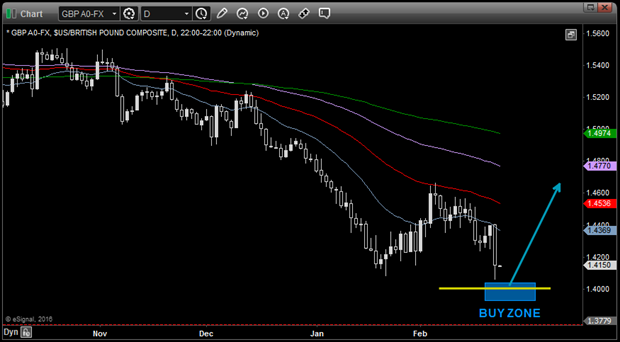
 TRADE UPDATE (Jan 30) - British Pound
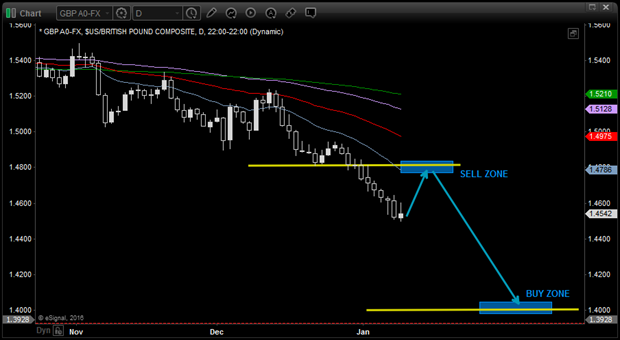
Over the past few weeks we have posted a number of trade updates regarding this currency that have all played out exactly as expected. The move down forcast in our first post from 1.45 to 1.40 is almost complete as is the double bottom pattern that so often presents itself in trend reversals in the currency.
Sentiment towards GBP has become extremely bearish with many mainstream news channels running stories regarding its demise, often a signal on its own that we are nearing a market low.
Commercial buying has quietly reached historically high levels with the intermediate (18 month) and short (6 month) term COT indexes hitting 100% extremes, and I would expect this weeks data to show a further increase in the 36 month index as well. We will be paying very close attention to price action as we get closer to the 1.4000 level and view any possible break below this level as a very short term move and will provide an excellent buying opportunity.
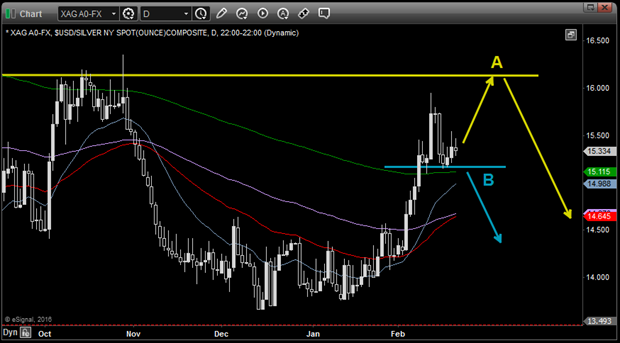
 NEW TRADE - Silver
This weekends data has seen the 36 month commercial COT index for Silver reach 0% for the 5th time in 18 months, with each of the last 4 times resulting in strong moves lower for the precious metal. The fall in the index has been driven by a sharp increase in commercial selling which is the perfect commercial sell signal. Commercial selling has come as non-commercial buying nears all time high extremes, which in the event of a move lower would only accelerate the move as they look to exit their large long position. Silver is also entering its period
forcast for a market top, making this market our prime target for this week.
As it stands options B seems more likely however option A would present a higher reward to risk trade. In the event of option B playing out we will be watching daily and 4 hourly charts closely for entry points.
 NEW TRADE - Dow Jones Industrial Average
Global stock markets have been marking the headlines in recent weeks, as they always do when they go down, it's funny how they are never talked about when they go up. Are we entering another major bear market such as 2008? Well we will find out very soon.
Currently the Dow sits above a significant support level @15675 with a similar level @1843 found on the S&P500. While we remain above these levels we are not convinced of calls for a bear market. A weekly close below is needed.
As per our
Seasonal Year Planner we are looking for a low this month and we will be taking a close look at our COT data for the Dow later this evening to find new commercial buying that could support this seasonal pattern.
NOTE - Due to the nature of how the S&P500 is traded by all types of traders as a means of hedging, it's COT is less representative of true commercial interest in the stock market. We recommend Dow COT data be used for trading both markets.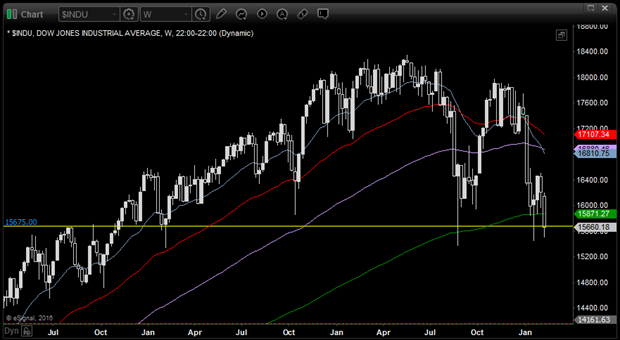
 TRADE UPDATE (Jan 12) - Crude Oil (+CAD & Heading Oil)
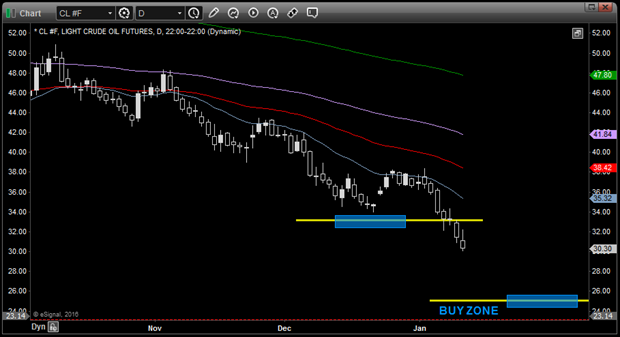
Has Crude Oil set its low? Well we don't think so. Speculators have driven the recent rally but commercials have used it as an opportunity to increase selling once again. We are near Crude's expected seasonal low (early/mid February) but we think another push lower will provide a much better entry point than the Jan 20 low we have already seen. Current technicals offer a potential short entry while staying focused on our long entry around $25 (Option B).
If Crude returns to $25, at that point we will also be looking for potential entry points into CAD long (USDCAD short) and Heating Oil long. These markets are strongly correlated with Crude oil and will move in line with its movement. We will not trade them all but will instead enter the market that provides the best entry point based on technicals and in particular, price action.
Given the nature of this market, we expect that when a low is posted, volitility will be as such to make staying in a trade long term very difficult. We will therefore be taking additional positions in
USO, the Crude ETF. With this not being a leveraged product we can be more accomodating with our stoploss as we look to stay in this market long term.
NEW TRADE - Soybean Meal
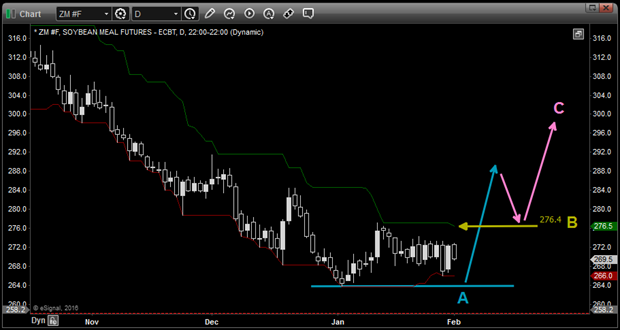
COT data for this market has been bullish for some time and we have been watching its progress closely in recent weeks. Commercials have become extreme bullish in this time with long contracts reaching an ATH and all Comm Index's reaching 100%. Non-commercials have also posted an extreme after reaching an ATH in their short contracts which is often a bullish reversal signal. Commercial's are now Net long, which hasn't happened since late 2011, and resulted in a major 8 month rally. This has been common place when Commercial's have went Net long in this market. We are also entering the strongest the seasonal period for this market which should see a rally through June.
Current price action has not yet provided any clues as to the start of any potential rally so we have highlighted 3 possible entry points that we will be considering. Option B is our favoured entry for current conditions. This uses a
trend following method that would enter us on a break above the highest high of last 13 days (green line) with a stop at the lowest low of last 13 days (red line) Option A would be based on a potential price action rejection at the current recent low, while option C would a retest of the current range follow a break. This option is the safest but often during commodity rallies price does not retest following a breakout which would mean missing out.
 TRADE UPDATE (Jan 10) - British Pound
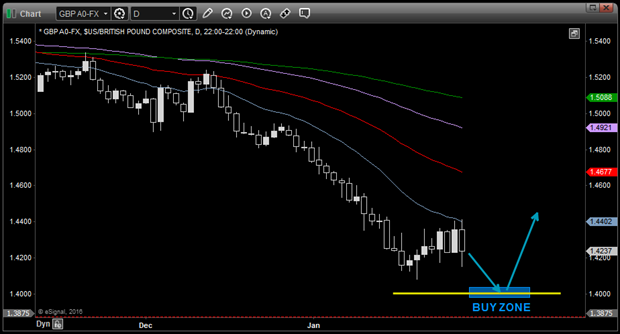
On Jan 10 we recommended staying short GBP until reaching the 1.4000 level and now it has done exactly that and we near our next potential trade entry @ 1.4000. This level has long been the floor for this currency and we are looking for it to hold once again as we seek a entry long. This weeks COT data again seen increased buying by Commercials', taking their long position in GBP to over 200,000 contracts for only the second time. Short and Medium term Comm index values have reached the bullish extreme of 100%, and the long term 36m index has reached its highest level since June 2013.
Based on the bullish COT data we already have, we are fully expecting a rally from this area, if data was continue to become more bullish with the 36m comm index hitting 100% and/or Commercial long ATH (all time high) this would give greater confidence in the potential size of the move and result in setting a larger trade target, likely back at the 1.7000 area. From our
Seasonal planner you will be aware we are expecting a seasonal rally now, so this simply confirms what we can already see.
Wait for price action to confirm its intention to reject this level, GBP often double tops and double bottoms at significant levels so that will be the prefect signal again this time.
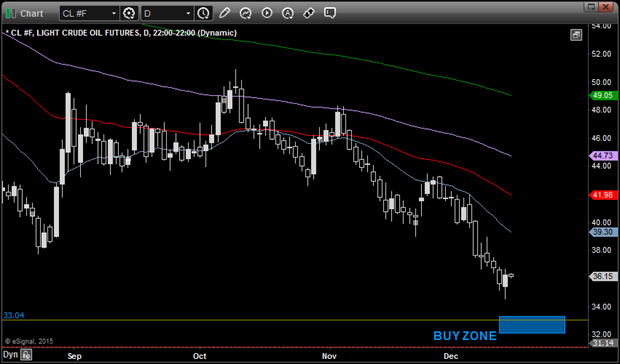
 TRADE UPDATE (DEC 07) - Crude Oil
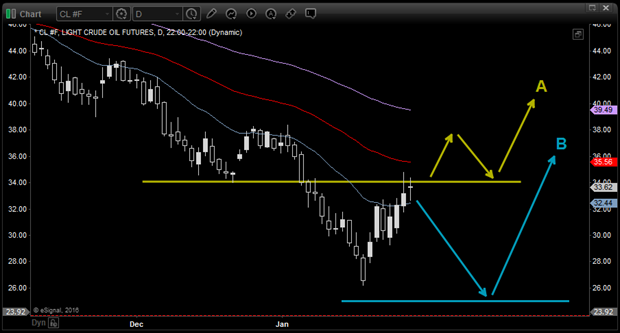
We are headed for $25 oil. On Dec 7th we first posted this trade looking at a possible buy point in Crude oil at the major support level of $33(upper blue box). Price did have a brief rally from this area but as we previously stated, if we continue to see a lack of commercial buying interest then price would continue to drift lower. At this point price has broken $33 and with no support until we reach $25, we will remain on the sell side.
This weeks COT data again shows little signs of commercial buying to stop this decline, but with Crude's seasonal bullish period due to start in early February, a low @$25 (lower blue box) combined with an increase in commercial buying could be the buy signal we have been waiting for.
 NEW TRADE - British Pound
Short term COT data has stayed bullish again this week for the British Pound with the 6m Commercial index remaining at 100%, this short term bullish signal could see the currency rally from current levels following last weeks sharp sell-off back into the 1.47/1.48 area. We don't recommend looking for long entries here as we are some way off major support and the trade offers a poor reward to risk ratio. We instead will be looking at any pull back as an opportunity to get short again.
It is worth noting that no major rally has ever started in this currency without the long term, 36m commercial index reaching 100% and we are some way off that. Seasonally we are bearish British Pound and that fits with current long term data. Our recommendation is to stay short until at least early/mid February which is when we expect the next seasonal rally. If in that time price can push down to the 1.40 level and commercials become extreme long on the 36m index, at that point we will consider taking long positions.
 NEW TRADE - Jananese Yen
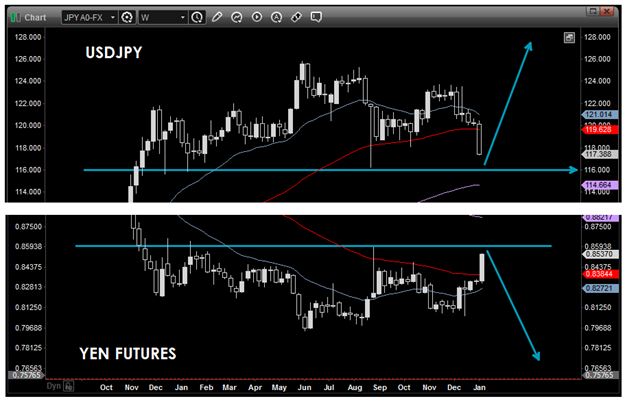
This weeks data shows speculators (non-commercials) have piled into the current rally in Yen, with a sharp increase in buying pushing their Net position from short to long. Given that we are currently in a range within an overall downtrend in Yen futures (Uptrend in USDJPY) we know that this increased speculative buying is against the main trend and commercial traders have used this rally as an opportunity to increae their short position pushing commercial COT Indexes to extreme readings of 0%. The current imbalance we can see between commercial and non-commercial traders have historically resulted in major tops and bottoms in this market, we will be looking for the same this time around with possible entry points @0.8600 (Futures) and @116.000 (USDJPY).
A weekly close above/below these levels will mean review of this trade. Note also, if Yen holds at these levels and turns as we are expecting, sentiment in major stock markets will also turn around and see them once again pushing higher.
 NEW TRADE - Canadian Dollar
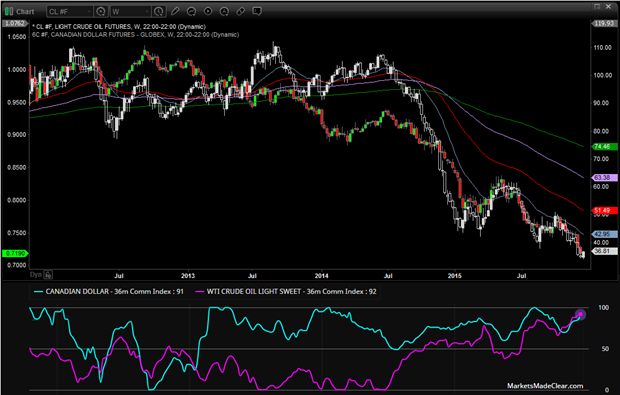
We posted a new trade alert on Crude Oil last week but also wanted to highlight a similar trading opportunity in the Canadian Dollar, by using its correlation with Crude Oil to your advantage. Below we have presented a chart showing both CAD (green/red candles) and Crude Oil (white/black candles) to illustrate this correlation. You can see how the price of these markets move up and down together, driven by the trading activity as recorded within our COT data, which also moves up and down together.
While their correlation is not always 100% you can see that throughout 2015 they have become as closely correlated as is possible, both in terms of price as well as their COT data. Both have COT indexes nearing extremes and both are approaching major support/resistance, Oil @ $33 and CAD @ 0.7100 (futures) or 1.4000 for USDCAD. CAD has seen an increase on commercial buying this week which is a bullish sign and we will be monitoring both markets closely in the coming weeks.
 TRADE UPDATE (Nov 26) - Gold
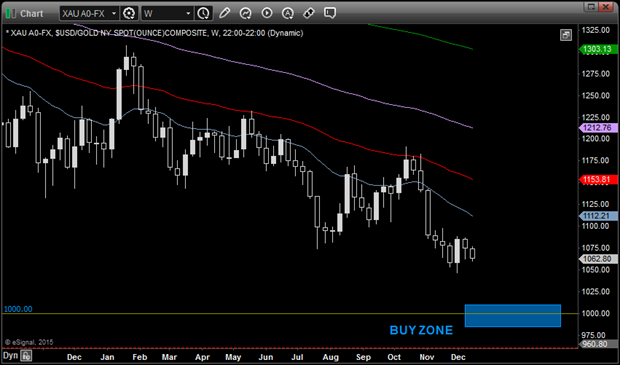
Previously we posted our view that Gold would reach the $1000 mark and we are sticking to this view. While Commercial COT Index readings are reaching bullish levels we can see that these are being driven by a sharp decline in commercial selling at current prices, but with an unwillingness to enter the market as buyers we don't currently see the right conditions in place for a major rally or long term low just yet. Speculators are in control at the moment and they are determined to drive the price of Gold to $1000, for the simple reason it has long been a target for the short side. We may see a small rally before we get there but we expect price to reach the buy zone indicated below. From there we will then be looking out for the increase in commercial buying that has always accompanied a market low.
 NEW TRADE - Crude Oil
The latest COT data continues to point lower as Crude nears long term major support. $33 marks the 2008 crash low with no further support until the $25 mark. We will be watching commercial positions closely in the coming weeks as we look for signs of increased commercial buying. So far they have remained content to reduce selling at current prices but their lack of buying indicates they believe price is still headed lower. A further drive lower could encourage some buying or we could see price consolidate at this level for a few weeks. Patience will be key to a successful trade here.
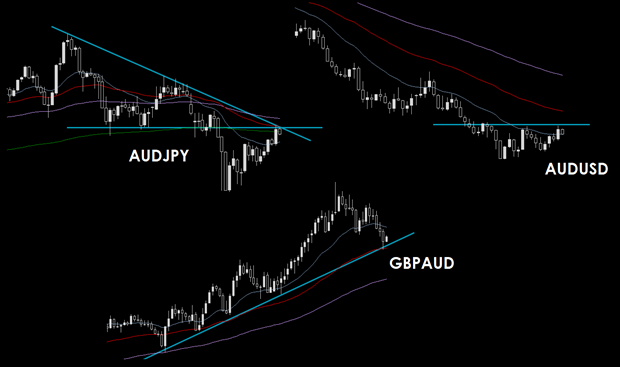
 NEW TRADE - Australian Dollar
A combination of bearish COT data and seasonal data has lead to our focus on looking for shorting opportunities in Australian dollar. Commercial traders increased their shorts by over 70% week on week and December is historically one of the Australian dollars worst months of the year. We have highlighted 3 charts that meet solid weekly technicals and it is in these 3 pairs we will be focusing our attention. Daily price action has yet to present solid entry points and we recommend switching between daily and 4 hour charts in the coming days for shorting opportunities.
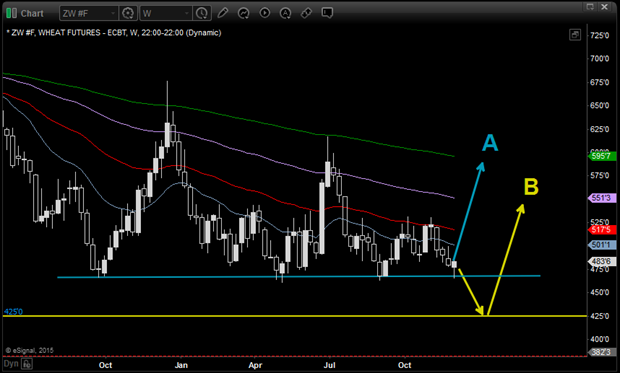
 NEW TRADE - Chicago Wheat (SRW)
SRW and HRW wheat are two markets we have been watching here for a few weeks, looking for possible set-ups for end of year rally. COT data for both markets has turned bullish, with COT indexes reaching or nearing extremes as a result of commercial buying in HRW reaching multi year highs and commercial selling reaching multi year lows in SRW, both bullish indicators. We will be monitoring daily time fames for entry points on both markets but we have highlighted SRW here due to its price action and respect for recent support at $470. There is also long term major support just below current levels at $425, so a break below could present a better buying opportunity.
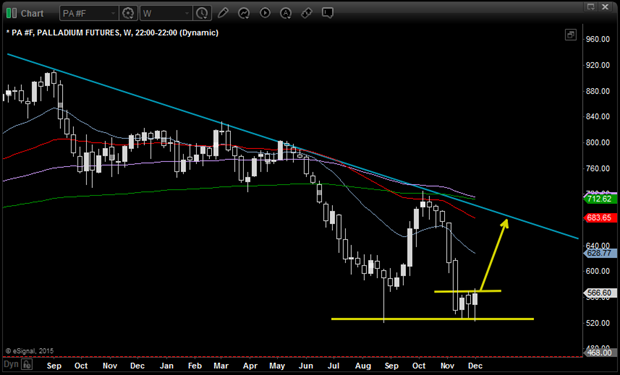
NEW TRADE - Palladium
This is one to watch. Latest COT data has turned bullish but not to the same extent that seen the previous major rally in Sept/Aug. Price has consolidated for 3 weeks at the $520 level where palladium continues to finds new buyers. Seasonall bullish and with major resistance some way above, any potential set up offers a good reward to risk. We will continue to monitor, check back for updates.
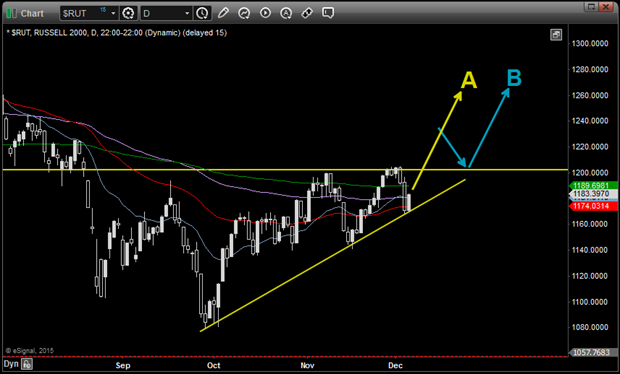
 NEW TRADE - Russell 2000 (Seasonal)
Seasonally $RUT is the strongest performer through December out of all the markets we cover here at MMC. The current rising wedge is building towards a break out of major resistance at 1200 which could see a push to new highs. With other major indexes already testing new highs, the reward to risk for the market is much more appealing. An entry from reversal bar on 4th (option A) is very aggressive and we favour a break above 1200 first before commiting. A break and retest at B would be ideal scenario.
 NEW TRADE - Gold
The last COT extreme in Gold gave way to the current down move and current data suggests there is still further downside potential for the metal before we should expect any significant move higher. Target still remains at $1000 as a long entry point where we find strong confluence of major horizontal support and fib extension. COT signals to look out for as we approach that level include ATH in commercial long positions, 100% COT index readings and potential commercial switch from net short to net long (hasn't happed since 2001). In the mean time we will be focused on looking for shorts. Check back for updates.

 NEW TRADE - Dollar Index
The USD approaches major long term resistance at 100 and we have identifyied two ways in which to trade this level. Current COT data does not indicate high levels of commercial selling so we are not expecting a major reversal at this point. Unless data turns strongly bearish we are expecting this level to break in the near term. Option A will follow a strong move higher from current levels with ideal entry at a retest of the 100 level from above. We could however see option B first following the recent strong sell of in EUR, which could see a pull back from current levels before the eventual break of 100. Check back for updates.

 NEW TRADE - Sugar
Recent COT data has become more bearish on Sugar but has not yet reached the extremes seen in the past that have pushed this market lower. Two options we would favour as a play to get short this market is a reversal rejection of the previous high at $15.50 (point A) price action and divergence are recommended signals here. This would be an eggressive entry point given the current nature of COT data. The safer option is an entry at the break of the previous low (point B) with a wide stop to allow the trade room to breath. A weekly close above point A will negate this current setup.

All content on this website is intended for educational purposes only. The advice, information or opinions are 'general guidance only' and do not
take individual circumstances into account. Do not trade or speculate based solely on the information provided here.