Chart reading is the foundation of all technical analysis and reading a chart incorrectly will mean all analysis thereafter on that chart will also be incorrect. So how do you read a chart? Well the simple answer is to
to read a chart and they would have no problem marking the highs and lows for you, but ask them why they marked those particular highs and lows and they
which unfortunately is of little help to you when starting out on your trading journey.
for determining whether or not a high is a high and a low is a low. These rules allow you to
on the chart and in particular, every high and low that connect the cycles together and whether they are higher or lower than the previous one high or low.
as an example. The red arrows shown, clearly mark each high and low and as they are getting higher each time, we can easily determine that this chart is making higher highs and higher lows and therefore in an uptrend. This example is very straight forward and if you were to mark this chart yourself you would most likely mark the highs and lows in the same place. Unfortunately however not every chart is made up of cycles that are as clear as this.
The next example in Figure 2.2 of GBPUSD tells a much different story. We have marked all the highs and lows again but you can see how much harder it is to read when compared to our previous AUDUSD chart example. This chart goes through periods of up-trend and down-trend and also at times no trend at all. It’s also not clear where all the highs and lows are which makes it easy to misread this chart and find yourself entering the wrong trade because you convinced yourself you saw something that wasn't there.
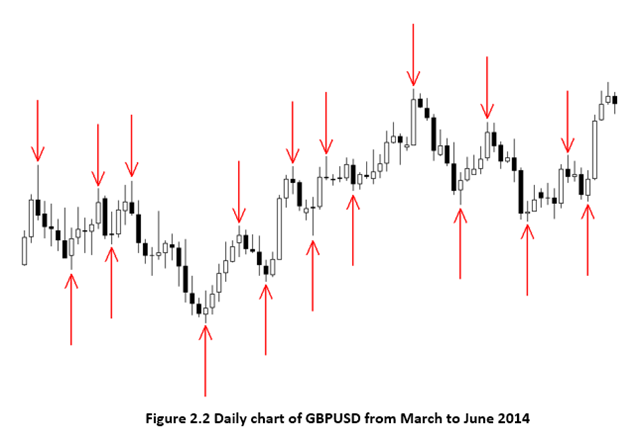
To stop this from happening we have developed the following
6 simple rules to remember when reading a chart. These rules work on any market using daily or weekly charts.
Note: In all out examples we will be using 'Candlestick charts' if you are not familiar with candlesticks, please click here before proceeding further.
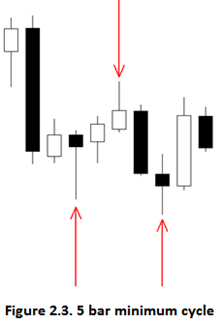 Rule 1 – 5 bars minimum
The underlying principal behind reading a chart is that one complete cycle must contain a minimum of 5 bars as shown in Figure 2.3. Within a cycle there will either be 2 lows and 1 high, as presented here, or 2 highs and 1 low. There is no maximum number of bars in a cycle however within FX markets a common cycle length typically contains 12 – 18 bars.
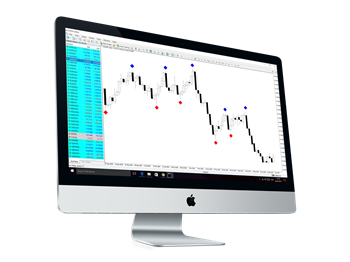 Want these rules applied automatically to your charts?
Now your charts can update automatically as the market moves, marking every confirmed high and low for you.
Available on MetaTraderIV,
Cycle Finder Pro™ is a unique indicator that will make sure you never read a chart wrong again.
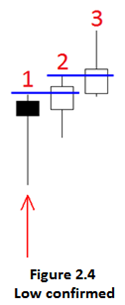 Rule 2 – Two higher bars confirm a low
A low can only be confirmed as a low once at least 2 subsequent bars have ‘taken out’ the high of the previous higher bar. In Figure 2.4 you can see how during the formation of bar 2, price moved up through the blue line representing the highest price traded on the previous day, bar 1, and in the process ‘taking out’ bar 1’s high. Bar 3 then proceeded to pass up through the blue line representing the highest price traded in day 2, ‘taking out’ day 2’s high and establishing a 2nd higher bar. It’s only at this point that the low of bar 1 can be confirmed as a low.
It is also important that during the formation of bars 2 and 3 that the low of these bars does not take out the lowest price traded on day 1. If this happens then the count must start again from this new low bar.
 Rule 3 – Bars do not need to be consecutive
The sequence illustrated in figure 2.4 will not always be present. It will not always happen that the two higher bars will be consecutive. This is fine but there still needs to be two higher bars out of the total number of bars following the low.
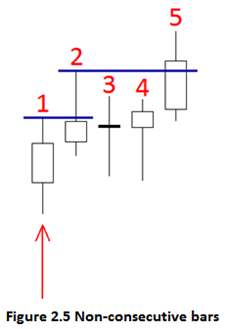
Figure 2.5 shows how it has taken 4 bars to give us 2 higher bars. Bar 2 started the sequence by taking out the high of bar 1, but bars 3 and 4 did not take out the high of bar 2 meaning the low is still not yet confirmed. It is only when bar 5 takes out the high of bar 2 that this low is confirmed.
Again notice that none of bars 2, 3, 4 or 5 moved lower than the low of bar 1, this is important.
 Rule 4 – Two lower bars confirm a high
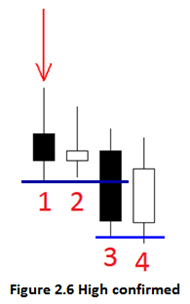
As with confirming a low, the same is also true for confirming a high, just in reverse. In this instance we need 2 bars to ‘take out’ the low of the previous bars low. Figure 2.6 shows how it took 3 bars to produce 2 lower bars. Bar 2 does not take out the low instead this is done by bar 3. Bar 4 then also takes out the low price of bar 3 and at this point we can confirm the high at bar 1.
When establishing a high it is important that the bars following bar 1 do not take out its high. See how bars 2, 3 and 4 have a lower highest trading price than bar 1.
 Rule 5 – Adapt to new price action
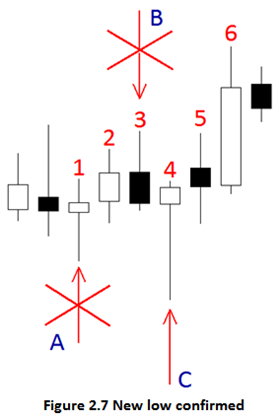
There will be times when you will need to be flexible and adapt as the chart unfolds. Figure 2.7 shows how a previous low (A) can be invalidated and a new low confirmed in its place (C). You can see how bars 2 and 3 produce higher highs and therefore bar 1 could be confirmed as a low. However bar 4 then gives us one lower bar that produces a new low before price moves higher again through bars 5 and 6. As there is only one lower bar following bar 3, bar 3 cannot be confirmed as a high. Without a high at B we cannot have a low at A. These two points are therefore invalidated and a new low is confirmed at C.
Rule 6 - Oversized bars
On occasion, there will be events that cause a market to behave abnormally and produce what is known as ‘oversized bars’. Oversized bars are defined as any bar being 3 times larger than the average bar on a typical chart. (you may wish to use an indicator such as ATR (average true range) to help calculate this)
Caused during extreme market volatility, these bars cause the normal structure of a chart to be interrupted, and a separate rule is therefore required to account for these.
There are two ways to deal with oversized bars.
 1. Oversized bar ignored.
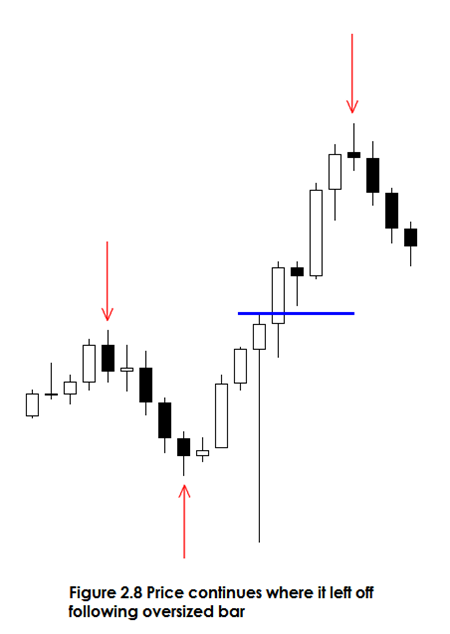
If price continues to move as it was prior to the oversized bar occurred, then the current market structure remains intact and the oversized bar is ignored, as is the case in Figure 2.8. Notice how price had been moving up from the confirmed low prior to the oversized bar, then broke the high of the oversized bar (blue line) immediately afterwards and continued moving up. It is for this reason we can ignore the bar, as it has had no impact on this market.
 2. Restart cycles after oversized bar.
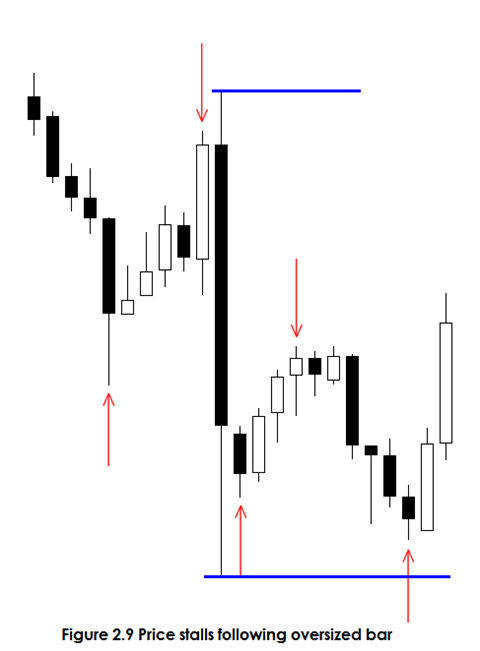
If on the other hand, price stalls as a result of the oversized bar, and price remains inside the oversized bar for an extended period, then the structure (cycles) are reset and we must wait for the new structure to be confirmed after the bar, as is the case in Figure 2.9. Notice how price has stayed within the oversized bars high and low (blue lines) but has produced a new cycle, confirming new highs and lows in the process. It is from these new highs and lows we will base our analysis of this market.
Thankfully these do not happen very often but it is important you know how to deal with oversized bars as reacting to them incorrectly can be very costly.
Next: How to score a chart