How to score a chart
The scores for the Currency Strength Matrix are based on chart structure and determined by the highs and lows within that market. Each chart must be systematically analysed in order to identify the correct highs and lows on every chart, so we can determine what the trend is on that chart. When doing this for the first time I recommend going back about 2 months on any daily chart and make your way to the current candle, identifying every high and low along the way. Once complete, we will score each chart based on its
2 most recent highs and 2 most recent lows.
These 4 points will tell us what trend/structure that market currently has, as any chart can
only ever have 1 of 4 possible patterns present at any given time, as illustrated in Figure 3.1.
A. Chart is making higher highs and higher lows (Uptrend)
B. Chart is making lower highs and lower lows (Downtrend)
C. Chart is making higher highs but lower lows (No Trend)
D. Chart is making lower highs but higher lows (No Trend)
The strength of each currency will then be based on their respective trends, with every uptrend being worth +1 to the strong currency in the pair, and every downtrend being worth -1 to the weak currency in the pair. If there is no agreement in the cycles (patterns C or D), then both currencies in that pair will be awarded 0.
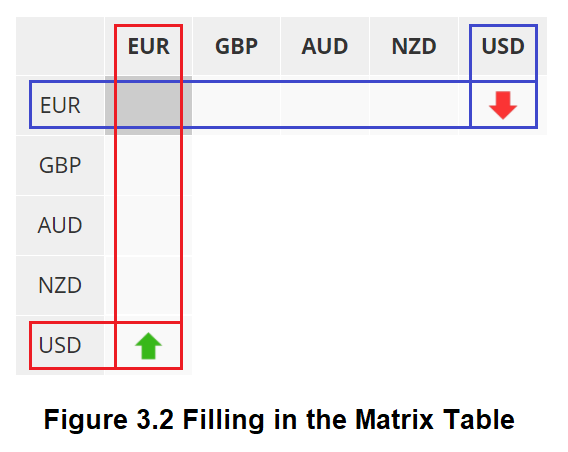
Using EURUSD as an example and looking at
pattern B in figure 3.1 as being the current price action of that pair, we can see it is making lower highs and lower lows. This means that at this time EUR is making lower highs and lower lows against USD, progressively moving lower, which means
EUR is in a downtrend (EURUSD, blue box in figure 3.2) and gets the down arrow for its weakness, and
USD is in an uptrend (USDEUR, red box in figure 3.2) and gets an up arrow for its strength.
N.B. If EUR is down against USD, then USD must be up against EUR.
Continuing with remaining patterns A, C and D, the trends for each currency would be as follows:
- Pattern A, EUR is making higher highs and higher lows against USD so this time EUR gets an up arrown, and USD gets a down arrow.
- Pattern C, EUR is making higher highs but also lower lows against USD, and therefore no agreement between the two cycles, both currencies get a sideways yellow arrow.
- Pattern D is similar to C, if EUR is making lower highs but also higher lows against USD, again there is no agreement and both again get a sideways yellow arrow.
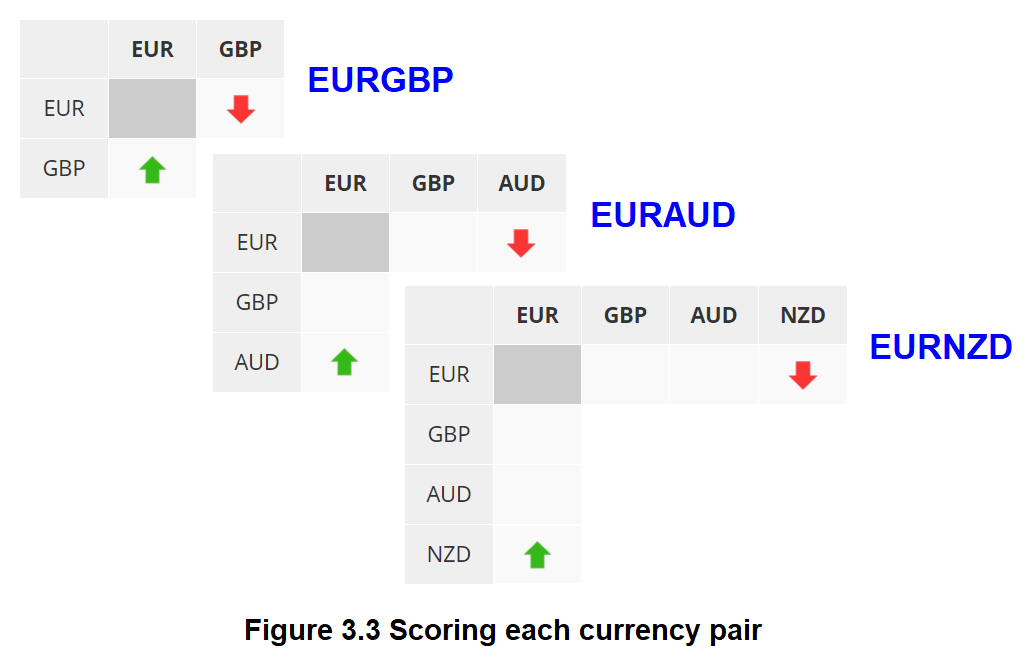
This process of identifying the trend is carried out for each of the
28 currency pairs, reading from left to right, starting with all the EUR pairs, EURGBP, EURAUD, AURNZD etc then moving on to the GBP pairs and then AUD pairs, (Figure 3.3) until all 49 cells of the Matrix are assigned a trend arrow as in Figure 3.4.
Note that in these examples, the three currency pairs are shown as
being in a down trend.
The final step in completing the Matrix table is to then count up the
total score for each currency. Reading horizontally across each row, up arrows are worth +1, while down arrows are worth -1 and yellow sideways arrows, for no trend, and worth 0. In the completed example below, Figure 3.4, we can see that EUR has 1 up arrow and 2 down arrows,
which gives it a total score of -1. Once we have completed this for the each currency you will see which currency is the strongest and which is the weakest. In this example we can see that NZD is the weakest with -5, and CAD is the strongest with +6, this means that looking to sell NZDCAD would have been a good option in recent trading sessions, and likely with continue to be until these strengths change.
Looking over the daily chart of NZDCAD, we can see that this currency pair is indeed in a strong down trend and has been for a peiod of roughly six weeks. The important thing to note here is that we knew this market was in a down trend before we even looked at the chart. This is the central purpose of using currency strength to trade, help to identify the best currency pairs to trade, as quickly as possible.
For a full explanation of how to
trade using currency strength, please check out our
Currency Strength Matrix user guide, which details 3 of the most common methods for trading currency strength.